/* Logrank test for many group survival difference */

filename t01 url 'http://hedwig.mgh.harvard.edu/biostatistics/sites/default/files/public/education/tmp_sample_data.csv';

proc import file=t01 out=t01 dbms=csv replace;
run;

ods listing exclude ProductLimitEstimates;

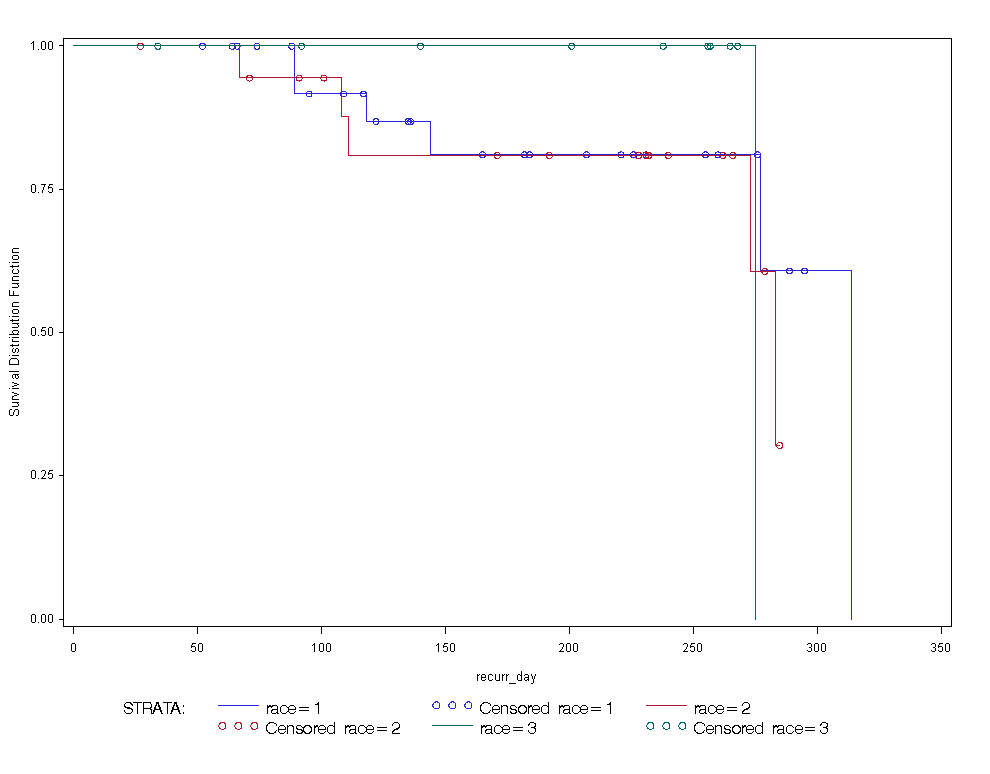
proc lifetest data=t01 plots=(s);
time recurr_day*recurrence(0);
strata race / test=logrank;
run;

/********************************** ANNOTATED RESULTS **********************************/

                              The LIFETEST Procedure

                               Stratum 1: race = 1

                Summary Statistics for Time Variable recurr_day

                                Quartile Estimates

                          Point          95% Confidence Interval
             Percent    Estimate    Transform      [Lower      Upper)

                 75     314.000    LOGLOG        277.000     314.000
                 50     314.000    LOGLOG        277.000     314.000
                 25     277.000    LOGLOG         89.000     314.000


                                Mean    Standard Error

                            268.454            19.390
                            
                            
                             The LIFETEST Procedure

                               Stratum 2: race = 2

                Summary Statistics for Time Variable recurr_day

                                Quartile Estimates

                          Point          95% Confidence Interval
             Percent    Estimate    Transform      [Lower      Upper)

                 75        .       LOGLOG        273.000        .
                 50     283.000    LOGLOG        273.000        .
                 25     273.000    LOGLOG         67.000     283.000


                                Mean    Standard Error

                            245.567            20.476

 NOTE: The mean survival time and its standard error were underestimated because
       the largest observation was censored and the estimation was restricted to
       the largest event time.
       

                             The LIFETEST Procedure

                               Stratum 3: race = 3

                Summary Statistics for Time Variable recurr_day

                                Quartile Estimates

                          Point          95% Confidence Interval
             Percent    Estimate    Transform      [Lower      Upper)

                 75     275.000    LOGLOG           .           .
                 50     275.000    LOGLOG           .           .
                 25     275.000    LOGLOG           .           .


                                Mean    Standard Error

                            275.000              .


             Summary of the Number of Censored and Uncensored Values

                                                                   Percent
       Stratum            race       Total  Failed    Censored    Censored

            1               1          31       6          25       80.65
            2               2          19       5          14       73.68
            3               3          10       1           9       90.00
       -------------------------------------------------------------------
        Total                          60      12          48       80.00


                              The LIFETEST Procedure

       Testing Homogeneity of Survival Curves for recurr_day over Strata


                                 Rank Statistics

                           race                Log-Rank

                                         1     -0.6017
                                         2      1.1421
                                         3     -0.5404


                  Covariance Matrix for the Log-Rank Statistics

 race                                1                    2                    3

               1              2.71719             -1.96918             -0.74801
               2             -1.96918              2.47956             -0.51038
               3             -0.74801             -0.51038              1.25840


                           Test of Equality over Strata

                                                       Pr >
                    Test      Chi-Square      DF    Chi-Square

                   Log-Rank      0.6069       2      0.7383a
            
        
a P-value indicating that the three survival curves are not significantly different
Kaplan Meier Survival Curves