/* Logrank test for two group survival difference */
filename t01 url 'http://hedwig.mgh.harvard.edu/biostatistics/sites/default/files/public/education/tmp_sample_data.csv';
proc import file=t01 out=t01 dbms=csv replace;
run;
ods listing exclude ProductLimitEstimates;
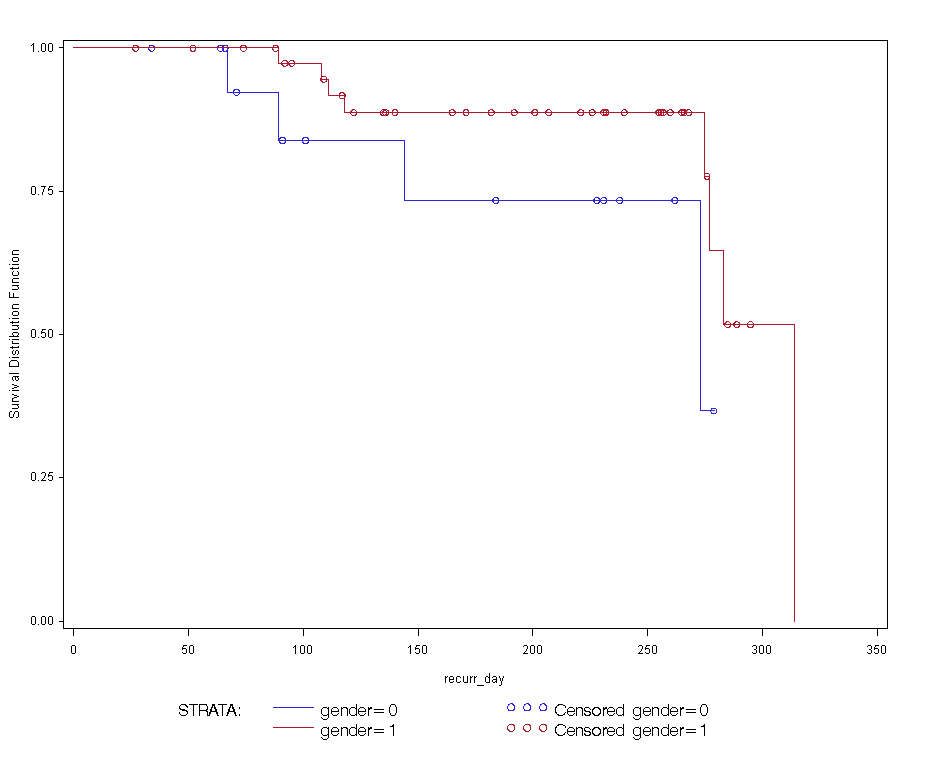
proc lifetest data=t01 plots=(s);
time recurr_day*recurrence(0);
strata gender / test=logrank;
run;
/********************************** ANNOTATED RESULTS **********************************/
The LIFETEST Procedure
Stratum 1: gender = 0
Summary Statistics for Time Variable recurr_day
Quartile Estimates
Point 95% Confidence Interval
Percent Estimate Transform [Lower Upper)
75 . LOGLOG 273.000 .
50 273.000 LOGLOG 89.000 .
25 144.000 LOGLOG 67.000 .
Mean Standard Error
228.182 26.004
NOTE: The mean survival time and its standard error were underestimated because
the largest observation was censored and the estimation was restricted to
the largest event time.
The LIFETEST Procedure
Stratum 2: gender = 1
Summary Statistics for Time Variable recurr_day
Quartile Estimates
Point 95% Confidence Interval
Percent Estimate Transform [Lower Upper)
75 314.000 LOGLOG 283.000 314.000
50 314.000 LOGLOG 275.000 314.000
25 277.000 LOGLOG 118.000 314.000
Mean Standard Error
277.601 12.572
Summary of the Number of Censored and Uncensored Values
Percent
Stratum gender Total Failed Censored Censored
1 0 16 4 12 75.00
2 1 44 8 36 81.82
-------------------------------------------------------------------
Total 60 12 48 80.00
The LIFETEST Procedure
Testing Homogeneity of Survival Curves for recurr_day over Strata
Rank Statistics
gender Log-Rank
0 2.0302
1 -2.0302
Covariance Matrix for the Log-Rank Statistics
gender 0 1
0 1.55873 -1.55873
1 -1.55873 1.55873
Test of Equality over Strata
Pr >
Test Chi-Square DF Chi-Square
Log-Rank 2.6442 1 0.1039a