***************************************************************
* *
* Logrank test for many group survival difference *
* *
* *
***************************************************************
insheet using http://hedwig.mgh.harvard.edu/biostatistics/sites/default/files/public/education/tmp_sample_data.csv
stset recurr_day, failure(recurrence==1)
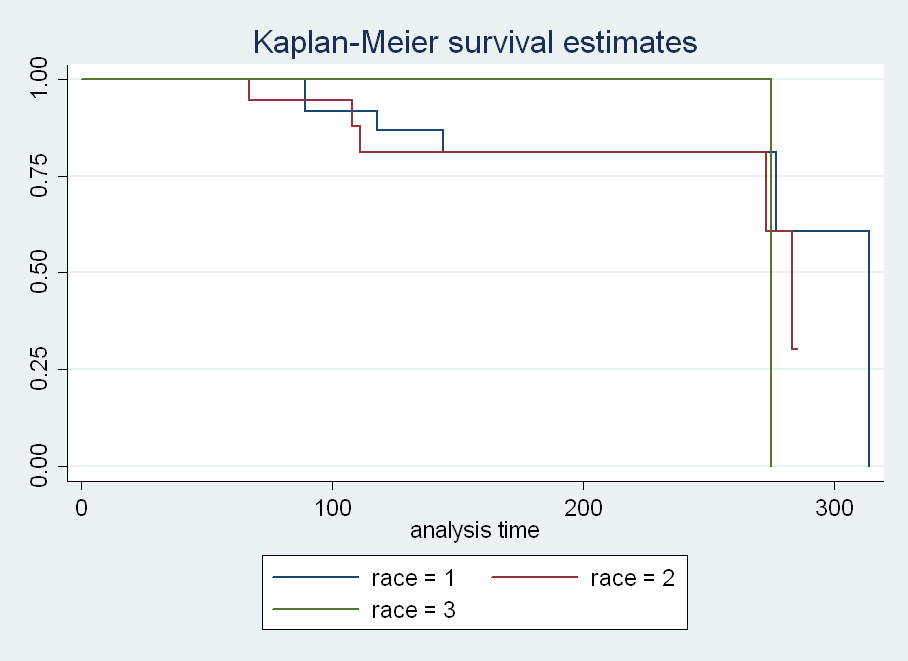
sts graph, by(race)
sts test race
********************************** ANNOTATED RESULTS **********************************
failure _d: recurrence == 1
analysis time _t: recurr_day
Log-rank test for equality of survivor functions
| Events Events
race | observed expected
------+-------------------------
1 | 6 6.60
2 | 5 3.86
3 | 1 1.54
------+-------------------------
Total | 12 12.00
chi2(2) = 0.61
Pr>chi2 = 0.7383